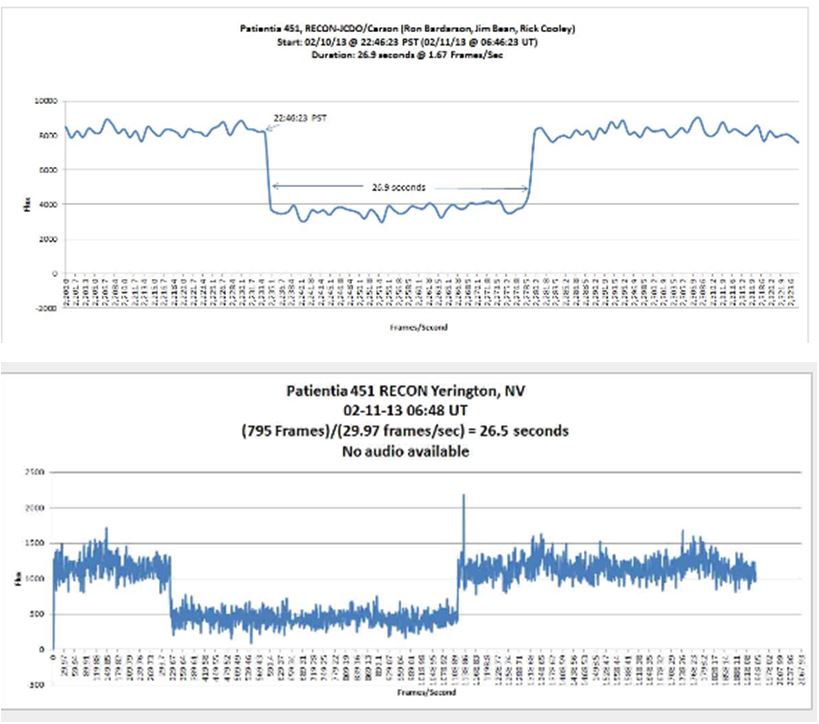
1. Construct an Excel graph of an asteroid occultation using video data and video software.
2. List and explain the steps involved in making observation –> collecting data –> processing data –> displaying data for interpretation
Key Vocab: Occultation, Light Intensity/Flux
Procedure
1. Visit & Download: Virtual Dub
2. Visit & Download: LiMovie
3. Obtain & save video data of an occultation event (raw-data)
- i.e. “occultation practice.avi”
- this avi file is usually compressed. LiMovie needs an uncompressed avi file, so you need now to uncompress it with VirtualDub – it’ll be much bigger
4 Run Virtual Dub
- Goal is to make an .avi file which LiMovie can read.
- File –> “Open Video File” –> select the proper data file
- File –> “Save as AVI” –> virtual dub will now process the video
- When finished, save the new file with a “marker” that indicates this is the file to use for LiMovie, i.e. “occultation practice-vd.avi”
5. Run LiMovie
- Limit is about 2041-frames or 68 seconds per analysis running at 29.97 frames/sec
- File –> “AVI File Open” –>select “occultation practice-vd.avi”
- Click on your target star and adjust the red circle (radius in number of pixels / radius box) until it encloses all of your star and as little sky as possible
- adjust the blue annulus to be beyond the red circle and not include any other stars or bad pixels. Make sure your star can’t slop over into this “doughnut.”
- make sure Kiwi is checked (middle right edge of the screen) if you have Kiwi OSD, then LiMovie will read the time stamps
- Star Tracking –> “drift” mode
- Use “Star Image [3D]” for proper radius aperture and background radius selections. Can use “noise reduction” mode for assistance
- “Measurement Panel” –> Start
- Light Curve Data will appear on the right-side. Note the frames being processed on the left under “Current Frame.” (29.97 Frames/sec)
- When complete, “Save to “CSV-File” (Excel-Lite), i.e. “practice occultation”
- Open CSV-File, Select entire column “k”. Make graph, the output will be Light Flux (Y-axis) vs Frame Number (X-Axis). Save as an Excel file with filename yyyymmdd_curve
- Optional…You might want to format the x-axis to make each major unit 29.97. Each mark is about 1-second of time duration.
Video Longer than 68-seconds
- Use video software to separate file into 2-smaller files under 68-seconds each. Note the exact frame when you separate
- Perform the above steps for each video file.
- Combine the two CSV files into one, i.e. copy-paste
OTHER LINKS
Courtesy of www.occultations.net


