Determining Orbits

Portola RECON member Warren asked for more details about how I go from images to orbits for the TNOs we’re interested in. Let me explain.

Most people know that planets, asteroids, and TNOs all orbit the Sun.  The force of gravity keeps everything bound together into what we know as the solar system  Remember about Kepler and Newton? From their work we have a mathematical theory that describes motion under the force of gravity. If you have just two objects, like the Sun and a single TNO, this simple theory can perfectly describe the motion of these two, forever. The path the TNO takes through space is called its orbit. Now, in our case, we really care more about the mathematical description of its motion. Kepler’s mathematical formalism requires the determination of six parameters at some specific time. Those parameters collectively are known as orbital elements and consist of the semi-major axis, eccentricity, inclination, longitude of the ascending node, longitude of perihelion, and the mean anomaly. From these values it is possible to calculate where an object is at any time.

Ok, so that’s the perfect setup. What’s it like in real life? First of all, you can’t just divine or even directly measure any of the orbital elements. Second, there are far more than two objects in our solar system. Here’s where it starts to get tricky (and sometimes interesting, but that’s a story for another day). Let’s just worry about the first part for now. What can we measure? Well, our most useful instrument is a camera. With this we get an image of the sky that contains stars, galaxies, and perhaps our TNO at some known time and from some known location. Most, if not all, of the stars and galaxies will be objects whose positions are already known. These are known as catalog objects and are used as positional references. Using the catalog objects we can calibrate the correspondence between a position in the image to the coordinates on the sky (known as the celestial sphere). Most of the time this is rather simple. You work out the angular scale of the
image (arc-seconds per pixel) and the sky coordinate of the center of the image. From that you can then calculate the sky coordinate of any pixel.  When you work with wide-field cameras there are often distortions in the image that need to be mapped out. Ok, so you see you TNO on the image and then compute its position. This position, known as right ascension and declination, is a pair of angles measured from a single reference point on the sky.

Having a single position is not good enough yet to compute an orbit.  Not only do you need to know where it is but you also need to know its velocity (speed and direction). With perfect data, you could simply wait some time from your first picture and then take another.  These two positions now give you a measure of the velocity. There’s a
catch, though. First, you never have perfect data. That means your limited in what you can learn in just two measurements. There’s something you cannot easily measure from just two positions. On the sky you get a good measurement of the sky position and the velocity as seen in the sky.  You do not have good information on how far away it is or how fast it
is moving toward or away from you. A clever guy named Vaisala figured out a trick for working with limited data like this.  His trick was to guess what distance the object is at and you guess that it’s currently at perihelion. Perihelion is when the object is at its closest distance from the sun during its orbit. Unfortunately, with just two points there are lots of guesses that will give you a reasonable orbit but you don’t yet know which is right. Still, it can help you to pick something reasonable that can be used to predict where it will be the next few nights.

As you continue to make measurements (more images at later times), you build up what is called the “observational arc”. Formally, this is the time between your first measurement and your last measurement.  As this time gets longer, you can get better and better quality orbits.  By that I mean the orbit you think you have gets closer and closer to the true orbit. Now, what about that second thing I mentioned before?  Right, there are other things around than just the sun and the one TNO.  That means the position and velocity of everything in the solar system depends slightly on the position of all the other objects in the solar system. To get a perfect description you really need to have a catalog that is 100% accurate and complete. This isn’t very likely so we’re resigned to always having orbits that are really just approximations.  Are these good enough? In most cases, all you want to do is to find a TNO in your telescope again. That’s the easiest condition to meet.  If you want to see an occultation of a star by a TNO we need a very precise orbit. Finally, if you want to send a spacecraft to a TNO we need something extremely good.

You can make your orbits better in different ways. The easiest is to simply wait and then take another picture. Bit by bit as time marches on you will get a better and better orbit. How long you have to wait for a good orbit depends on where the object is in the solar system.  Objects closer to the Sun move faster and in so doing let you get a good orbit more quickly than a slow moving object. For a main-belt asteroid orbiting between Mars and Jupiter you generally get an excellent orbit (good for occultations) in just 4-5 years. Note that the one thing that does you no real good is to just take lots and lots of pictures.  Time is a lot more valuable than the number of measurements. In fact, on a single night you get the same information from 2-4 observations as you would from a thousand in one night. In the early days after discovery you need to observe more often but then things spread out considerably.  One rule of thumb I use is the “rule of doubling”. This rule says that you want to wait twice as long as your current observational arc before you both to measure it again. Here’s an example: you find a new TNO on some night with two images that are one hour apart. The third image should be three hours after the first image. The fourth should be at 6 hours, the fifth at 12, then at 1 day, 2 day, 4 day, 8 day, 16 day, 32 day, and so on. After a while you are waiting years or even decades for that factor of two. Now, this really isn’t a rigorous rule, after all, the Sun keeps coming up making it hard to see your object. Still, if you followed this rule you would never lose a newly discovered object.

Another way to get better orbits if you are impatient is to use a more accurate catalog. The quality of your positions for your TNO is only as good as your catalog. If you use a better catalog you get better positions. The problem is that this is really hard to do. We’ve got really good catalogs now but they could be a lot better. In fact, there is a European mission, named Gaia and planned for launch later this year, that will measure all the star positions to an unprecedented accuracy.  I can’t say enough about this mission. It will completely revolutionize occultation observations by making it very easy to predict where the asteroid shadows will fall. Alas, it’s going to be quite a few years before these results are available and work their way into better TNO positions.

A third way that works really well is to use radar. The Arecibo and Goldstone radio telescopes are used for this with near-Earth asteroids where they bounce a signal off the asteroid and analyze the return signal.  Radar is especially valuable because it can directly measure distance to the target and how fast it is moving toward or away from us. The problem is that the objects have be close. It’s just not practical to use this method on a TNO.

Now, think about sitting at the telescope and trying to get better orbits.  That’s what I was doing in March, 2013. I have information on every measurement ever made of a TNO (asteroids too, for that matter) and I know something about how good the orbit is. I’m looking for objects whose positions are poorly predicted that have not been seen in a while.  This is a very complicated thing to do at the telescope and I have some very powerful software that helps me keep track of what I’ve done and what I might be able to do as the night goes on. I can say that 3 clear nights on a big telescope can be a very exhausting experience but well worth the effort. Then, once the night is over there is the task of getting the positional measurements off the images. I’ll leave that discussion for another time.

Isolda event update

The Isolda event is tomorrow night for those of you interested.  I note that we’ve got one RECON site signed up for this.  I’m currently in Flagstaff and I will attempt the event as well, weather permitting.  The forecast here is for clearing conditions.  I’m waiting until closer to event time before signing up for a location to see who else will give it a try (IOTA or RECON).  If you do intend to observe this you really need to sign up on OW.  As more show up, the IOTA folks will hopefully treat it more seriously.  I posted a message to the IOTAoccultations group to try and drum up interest.

This event will be very interesting even if we only have a few of us doing it provided we also get some IOTA members to participate.  We will get our first chance to compared timing results from our cameras to the more well-tested systems that IOTA uses.

On the event page I have recommended a senseup setting of x12.  I have not actually used this on the field but instead have estimated the setting from other test data I’ve taken.  If I did this right the star will be there but not terribly bright in the image you’ll see.  If you just can’t see it, go slower to make sure but this is a good starting point.  I would like to ask those of you trying this with larger telescopes (12″ or 14″) to use a slightly faster senseup setting.  On a 12″ x10 would be the same as x12 on an 11″.  I don’t remember if there is an x10 setting or not, though.  If not, use x12.  For a 14″, x8 would be equivalent.  I think that’s a valid setting.  I’m interested in getting chords with different senseup settings to see if there is a change in the timing we extract that depends on the sense up setting.

Occultation Light Curves for Teachers/Students/Others

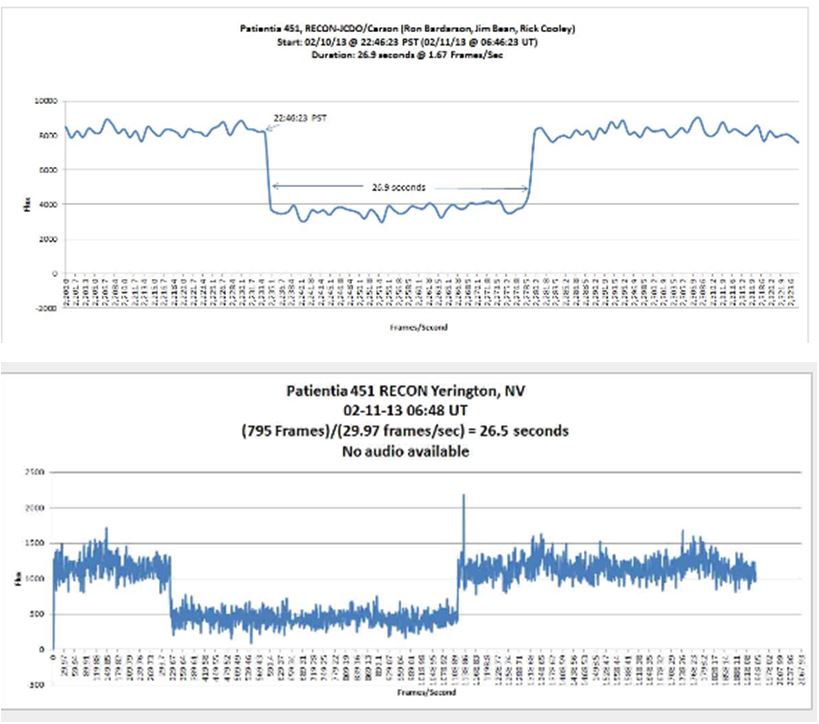
RECON Example JCDO vs Yerington Objectives:

1. Construct an Excel graph of an asteroid occultation using video data and video software.

2. List and explain the steps involved in making observation –> collecting data –> processing data –> displaying data for interpretation

Key Vocab: Occultation, Light Intensity/Flux

Procedure

1. Visit & Download: Virtual Dub

2. Visit & Download: LiMovie

3. Obtain & save video data of an occultation event (raw-data)

  • i.e. “occultation practice.avi”
  •  this avi file is usually compressed. LiMovie needs an uncompressed avi file, so you need now to uncompress it with VirtualDub – it’ll be much bigger

4 Run Virtual Dub

  • Goal is to make an .avi file which LiMovie can read.
  • File –> “Open Video File” –> select the proper data file
  • File –> “Save as AVI” –> virtual dub will now process the video
  • When finished, save the new file with a “marker” that indicates this is the file to use for LiMovie, i.e. “occultation practice-vd.avi”

5. Run LiMovie

  •  Limit is about 2041-frames or 68 seconds per analysis running at 29.97 frames/sec
  • File –> “AVI File Open” –>select “occultation practice-vd.avi”
  •  Click on your target star and adjust the red circle (radius in number of pixels / radius box) until it encloses all of your star and as little sky as possible
  •  adjust the blue annulus to be beyond the red circle and not include any other stars or bad pixels. Make sure your star can’t slop over into this “doughnut.”
  •  make sure Kiwi is checked (middle right edge of the screen) if you have Kiwi OSD, then LiMovie will read the time stamps
  • Star Tracking –> “drift” mode
  • Use “Star Image [3D]” for proper radius aperture and background radius selections. Can use “noise reduction” mode for assistance
  • “Measurement Panel”  –> Start
  • Light Curve Data will appear on the right-side. Note the frames being processed on the left under “Current Frame.” (29.97 Frames/sec)
  • When complete, “Save to “CSV-File” (Excel-Lite), i.e. “practice occultation”
  • Open CSV-File, Select entire column “k”. Make graph, the output will be Light Flux (Y-axis) vs Frame Number (X-Axis). Save as an Excel file with filename yyyymmdd_curve
  • Optional…You might want to format the x-axis to make each major unit 29.97. Each mark is about 1-second of time duration.

Video Longer than 68-seconds

  • Use video software to separate file into 2-smaller files under 68-seconds each. Note the exact frame when you separate
  • Perform the above steps for each video file.
  • Combine the two CSV files into one, i.e. copy-paste

OTHER LINKS

Courtesy of www.occultations.net

Busy days

These have been busy days since the Kitt Peak observing run.  Those observations are critical for us to help find interesting occultation events to try but they are of no use in the form of images.  But that comment I mean that the easy part is over once the pictures are taken.  There’s a lot of image processing and analysis that is required.  I have to calibrate the images as well as map the sky coordinates.  After that I have to scan the images looking for all the moving things.  Most of the moving objects are main-belt asteroids but a few of them are the slow-moving Kuiper Belt objects that are our targets.  Once all these objects are found I then extract their positions and use that information to improve the orbits.  Good orbits are the key to letting me predict where these things will be at some future time.

This work, while difficult and time consuming, is made easier by the software that I’ve developed over the past 15 years.  One of the nasty realities in professional astronomy is that there is very little standardization in the data I get.  Usually, I can count on data from the same camera having the same data format.  But, this observing run was with a camera that I’ve never used before.  Even though this camera is on a telescope I’ve used, the data are just different enough that I had to rework a lot of my software.  In the process, I discovered that there was a serious problem in the supporting data.  One of the key bits of information I need to know is exactly when each picture was taken.  Without a good time, the observations are useless for our project.  Well, it turns out the times recorded by the camera was incorrect and off by as much as 12 minutes.  That may not sound like a lot to you but to me it’s huge.  Want to know how I figured this out?

Well, it’s like this.  Time on telescopes like this is very precious and I work very hard during my nights to make sure that I’m getting as much data as possible.  The ideal thing would be to be collecting light 100% of the time.  Unfortunately, there are unavoidable times when you can’t collect light.  After each picture we have to stop and read out the image and save it to the computer disk.  This camera is quite fast and can store the 16 mega-pixel image in about 25 seconds.  Not as fast as a commercial digital camera but then it’s much more precise and getting that precision requires a little extra time.  Now, each picture takes about 4 minutes to collect (that’s when the shutter is open and I’m integrating the light coming through the telescope).  If the readout were the only time I’m not collecting light then I could hope for 91% efficiency.  That’s pretty good.  But, there are other things that can eat into your observing efficiency.  For instance, the telescope needs to be moved between each picture.  If it can be moved and setup in less than 25 seconds there is no extra overhead.  Also, if I’m not very organized I might be sitting there in the control room trying to figure out what to do next and the system would be waiting on me.  Well, I have control over my part of the project and I always know what to do in time.  But, the telescope motion turned out to take longer than the readout of the image.  While observing I knew that we were losing time to moving the telescope but I didn’t know exactly how much.

Ok, so here I am looking at all the new data.  I was wondering just what the efficiency was. So, I wrote a simple program to calculate how much dead time there was between each exposure.  It really is simple to do, you take the difference in the start time of two exposures and then subtract the time the shutter was open.  The remainder is the overhead.  Well, to my surprise, the numbers came out very strange indeed.  About overhead of about 20% of the images were negative.  Do you know what that means?  It implies that some exposures were started before the previous image was completed.
That’s impossible!  After checking that my quickie program was working right, I then turned to my backup source of information.

One of my ingrained habits while observing is that I record a hand-written log of what I was doing.  These days most astronomers rely on automated and electronic logs that are based on what the data system knows.  Not me.  I record information about each picture as an independent check on the system.  Most of the time everything is fine and the logs are somewhat superfluous.  This time, I was able to use the start times I wrote down to show conclusively that the data system was messed up.  I sent a report back to the observatory and after considerable effort were able to verify the problem, what happened, and then a manual recipe for fixing the data based on their backup information.  What a mess.  This detour consumed the better part of 3 days worth of work.

Well, no need to recount every last thing I’ve been doing the past couple of weeks.  But, at this point I’ve scanned about 1/3 of the data.  I successfully recovered 29 out of 36 objects I was trying to get.  I had to write an observing proposal to do this again in the fall.  I asked for three more nights.  The data processing continues on the rest of the data.  On top of this, we’re planning the details for the upcoming training workshop next week.  I’m very excited about getting together with everyone and getting everyone ready to observe.  I think we’re going to have a great time together as we get this project up and running.  We may have some challenges caused by the weather.  The forecast is not perfect but I’ll note that it is much better than the weather this weekend.

On Tuesday morning I get on the California Zephyr train, yes, a train, to get to the workshop.  This will be a nice break from flying around the world.  The scenery should be excellent on the ride and I’ll have time to continue to work on getting ready for the workshop.  I want to thank all of you signed up to participate.  This project is a lot of work but I’m grateful for your willingness and enthusiasm to be involved in the project.  I can’t do it without you and together we’ll amaze the world.  For those coming to the workshop, drive safe, and we’ll see you in Carson City!